This problem from the British Math Olympiad is a great example of the power of visualization.
This problem from the 2009 British Mathematical Olympiad has an elegant solution that involves visual mapping of the problem to its final solution.
Let us try to visualize this problem using a $10 \times 6$ grid as shown in the following figure. Let each horizontal line represent Isaac's score for the corresponding question. Starting at the point $A$ you move down to the line representing the score for the next question. Once at the score you move right to cover the question, then you move to the score of the next question.
Since the scores of the questions are strictly in non-increasing order, you either move down or right to reach point $B$.
-----------book page break-----------
In the following diagram the red path shows a score of $10, 8, 8, 5, 5, 2$ in questions $1$ to $6$ respectively,
and the blue path shows score of $9, 9, 7, 7, 1, 0$ for these six questions.
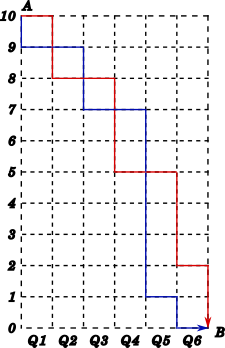
Therefore, a possible scoring pattern can be obtained by finding the arrangement of $10$ down movement and $6$ movements to the right. This can be done in $\dfrac{16!}{10! 6!} = 8008$ ways. You can learn more about permutations .